For years, recruiting has been focused on speed and efficiency. We measured success by how fast we could fill a seat (time-to-fill) and how little it cost to do so (cost-per-hire). But this approach misses the most important question: did we actually hire the right person?
Quality of hire is the metric that answers this question. It’s not about how fast or cheap the process was, but about the long-term value a new employee brings to your organization. It's the ultimate measure of a recruiting team’s success.
Why Quality of Hire Is Your New Recruiting North Star

Focusing only on speed and cost is like judging a chef by how quickly and cheaply they can make a meal—without ever tasting the food. You might get a full plate, but you're probably not getting a five-star experience. It’s a recipe for disappointment, leaving you with a team that’s just adequate, instead of one that’s built to perform.
This old way of thinking is giving way to a more strategic mindset. We're moving from a simple game of speed to a sophisticated game of impact.
From Speed to Substance
The shift from speed-based metrics to quality-based ones represents a significant leap forward in how we think about building teams. It's the difference between just filling a roster and carefully scouting for a championship-caliber player. One fills a temporary gap; the other can change the trajectory of the team.
Let's look at how the focus is evolving. Traditional metrics told us how fast we were working, while the new ones tell us how well.
The Evolution of Core Recruiting Metrics
| Focus Area | Traditional Metric (The 'How Fast') | Modern Metric (The 'How Well') |
|---|---|---|
| Sourcing | Number of Applicants | Candidate Pass-Through Rates, Source of Top Performers |
| Process | Time-to-Fill, Cost-per-Hire | Candidate Satisfaction (NPS), Interview-to-Offer Ratio |
| Outcome | Offer Acceptance Rate | Quality of Hire, 90-Day Retention Rate |
| Business Impact | Recruiting Budget Adherence | New Hire Performance, Employee Lifetime Value (ELTV) |
This isn't just a theory; it's a measurable trend that's redefining the industry. Smart leaders are realizing that the "who" is infinitely more important than the "how fast."
In fact, the tide has already turned. A recent benchmark report reveals a clear change in what talent leaders value most.
According to the 2026 State of Staffing Benchmarking Report, 31% of staffing agencies now rank quality of hire as their top ROI metric. For the first time, it has surpassed traditional benchmarks like cost-per-hire (19%) and time-to-fill (18%).
This data confirms it: the conversation has moved from cost-cutting to value creation. You can explore the complete findings in the full research on StaffingHub.
The True Cost of Every Hiring Decision
Think of every new hire as an investment. A good hire is an appreciating asset. Their contributions compound over time, driving innovation, mentoring teammates, and lifting the entire organization. Their value grows far beyond their initial salary.
A poor hire, on the other hand, is a compounding liability. The damage goes much deeper than just weak performance. The ripple effects are costly and widespread:
- Lost Productivity: It’s not just their own lack of output. It's the hours your managers and top performers lose cleaning up mistakes, redoing work, and providing extra support.
- Damaged Morale: One disengaged or mismatched employee can drain the energy and passion from the entire team.
- Wasted Resources: All the time and money poured into recruiting, onboarding, and training that person? It’s gone. And now you have to spend it all over again.
When you start prioritizing quality of hire, you stop plugging holes and start building a foundation for sustainable growth. You’re making a direct investment in your company’s future. This guide will give you the blueprint to measure what truly matters and demonstrate the impact of a strong talent strategy.
The Essential Quality of Hire Metrics You Should Track
Trying to pin down "quality of hire" with a single number is difficult. Think of it more like a diagnostic dashboard for your hiring engine. You need a set of complementary gauges—some tracking immediate performance, others monitoring long-term health—to truly understand if your recruiting efforts are paying off.
By combining the right data points, you stop relying on gut feelings and start building a clear, defensible case for the value each new hire brings. We can break these vital signs into two camps: Performance Indicators and Retention Indicators.
Performance Indicators: How Well They Do the Job
First things first: can the person actually do the job you hired them for? Performance indicators cut right to the chase, measuring a new employee's impact and effectiveness once they’re on the team. They’re your proof that the person who impressed you in the interview can deliver when it counts.
New Hire Performance Rating: This is your most direct feedback loop. It's the formal grade a manager gives a new employee on their performance reviews, usually at the 90-day, 6-month, or 1-year mark. The key here is consistency; the competencies you rate in a review should mirror the skills you screened for during the hiring process.
Time to Productivity: How long does it take for a new hire to become a fully contributing team member? This metric tracks the journey from needing constant guidance to becoming autonomous. A short ramp-up time is a positive sign of a good hire who is onboarding smoothly and adding value quickly.
Hiring Manager Satisfaction: Let's be honest, this one is important. Is the manager who works with the new hire every single day satisfied? A quick survey sent to the hiring manager 90 days after the start date can reveal a lot. Asking them to rate their satisfaction with the hire’s skills, cultural contribution, and overall performance is a powerful reality check on your entire process.
These metrics tell you if you're hiring people who can move the needle. They answer the "what"—what value is this person creating for the business right now? This is where a deep, initial understanding of the role's real-world demands becomes critical. To ensure your interviews are measuring what matters, it pays to use a structured approach. We cover this in our guide on building an interview scoring rubric template.
Retention Indicators: If They Stick Around
Hiring a strong performer feels great, but that victory is short-lived if they walk out the door before their first anniversary. Retention indicators measure how "sticky" your hires are, showing whether you’re bringing in people who are in it for the long haul.
The line between recruiting and retention is blurry for a reason. High first-year turnover is almost always a recruiting problem in disguise, a flashing red light that points to a mismatch somewhere in the hiring process.
But tracking retention is more than just a headcount. It’s about finding the story in the data.
First-Year Retention Rate: This is the big one. It answers a simple, crucial question: Of all the people we hired last year, what percentage are still here today? A high rate is a strong signal that you're finding people who genuinely align with the role, the manager, and the company culture.
Early Turnover Rate (First 90 Days): A new hire leaving within three months is both expensive and demoralizing for the whole team. This metric is your early warning system. Spikes in early turnover can point to urgent problems like misleading job descriptions, a broken onboarding experience, or a major gap between what was promised and the day-to-day reality.
Promotion Rate: Are the people you hire getting promoted? This is a useful lagging indicator of quality. When new hires advance within the company, it suggests you're identifying people with high potential. Tracking how many of your hires get promoted within their first 1-2 years validates that you’re not just filling seats—you're hiring your organization's future leaders.
When you blend these performance and retention metrics, you create a balanced scorecard for quality of hire. This isn't just about crunching HR data; it's about telling a clear, compelling story about business impact. It's how you prove that talent acquisition isn't a cost center, but one of the most powerful engines for growth your company has.
Cohesyve
See what candidates can do before you interview them
Cohesyve turns a job description into a role-specific assessment with a scoring rubric. Each candidate gets a different version, so questions cannot be shared. Ten candidates free, no card.
How to Calculate Quality of Hire with Real-World Examples
Alright, let's move from a list of metrics to a single, useful score. This is where you can take all that data and create one number that tells a clear, compelling story about your hiring success.
Calculating a composite Quality of Hire (QoH) score isn’t as complex as it might seem. We’ll walk through it step-by-step by following the journey of a new hire we'll call "Alex the Engineer." By tracking Alex’s first year, we can see exactly how to build a tangible QoH score from the ground up.
Step 1: Normalize the Data
First, we need to get our different data points speaking the same language. We have performance ratings, productivity timelines, and retention data—all measured differently. The trick is to convert each one to a common scale, usually from 0 to 100. This process is called normalization, and it’s what allows us to fairly compare apples and oranges.
Here’s how we can normalize the data from Alex's first year:
- 1-Year Performance Score: Alex earned a 4 out of 5 on their annual review. To normalize this, we do the math: (4 / 5) * 100 = 80.
- Time to Productivity: For an engineer, the target to hit full productivity is 6 months. Alex got there in 5 months—a positive sign. We’d calculate this as (6 months / 5 months) * 100, which equals 120. But to keep outliers from skewing our average, we can cap this score at 100.
- 1-Year Retention: Alex is still with the company after a year. This is a simple yes-or-no metric. Since the answer is yes, the score is 100. If they had left, it would be 0.
This normalization step gives us a consistent baseline for every metric we want to include. The process flow below shows how these inputs all feed into the bigger picture of calculating hire quality.
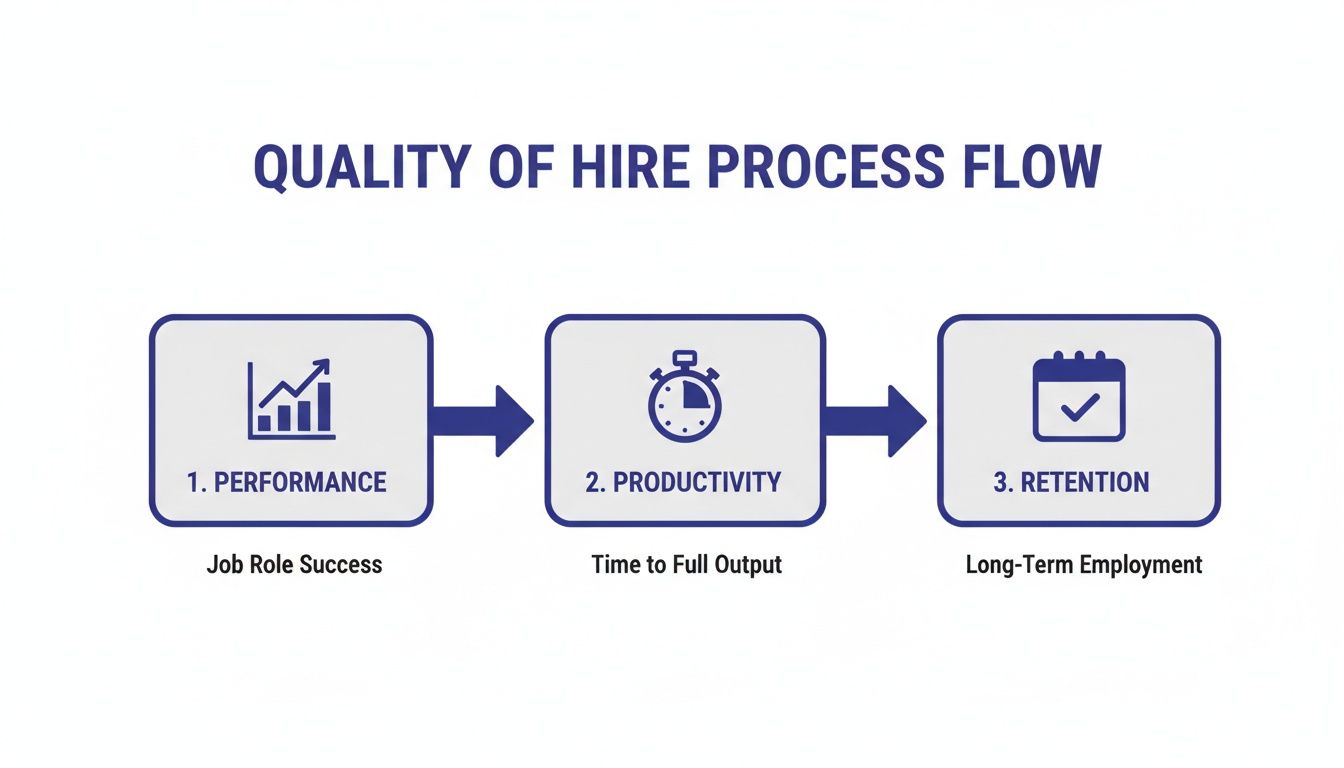
As you can see, blending these different perspectives on performance, productivity, and retention is what gives you a truly holistic view of a new hire's long-term value.
Step 2: Weight the Metrics
Not all metrics carry the same weight. For a senior engineer, long-term performance might be more important than how quickly they ramped up. This is where weighting comes in. It allows you to assign a level of importance to each metric based on what truly matters for that specific role.
For Alex’s engineering position, our priorities might look like this:
- Performance: 50% (this is the most critical factor)
- Productivity: 20%
- Retention: 30%
Just make sure your weights always add up to 100%.
Step 3: Calculate the Final QoH Score
Now for the easy part. We just multiply each normalized score by its weight and add them all together to get our final number.
(Performance Score × Weight) + (Productivity Score × Weight) + (Retention Score × Weight) = Final QoH Score
Let's plug in Alex's numbers:
- (80 × 0.50) = 40
- (100 × 0.20) = 20
- (100 × 0.30) = 30
Adding those up, we get 40 + 20 + 30 = 90. Alex’s final Quality of Hire score is a 90—a clear, data-backed signal of a great hire.
When you start applying this formula across roles, departments, and even hiring sources, you unlock the ability to make genuinely informed decisions about your talent strategy. The alternative is simply too expensive to ignore. Research underscores the financial impact of getting it wrong: a single bad hire can cost a company anywhere from $14,900 to $240,000. As you can discover more insights about these recruiting metrics on Ongig.com, the business case for moving beyond guesswork is clear.
Bringing Your Data to Life With a Strategic Hiring Dashboard
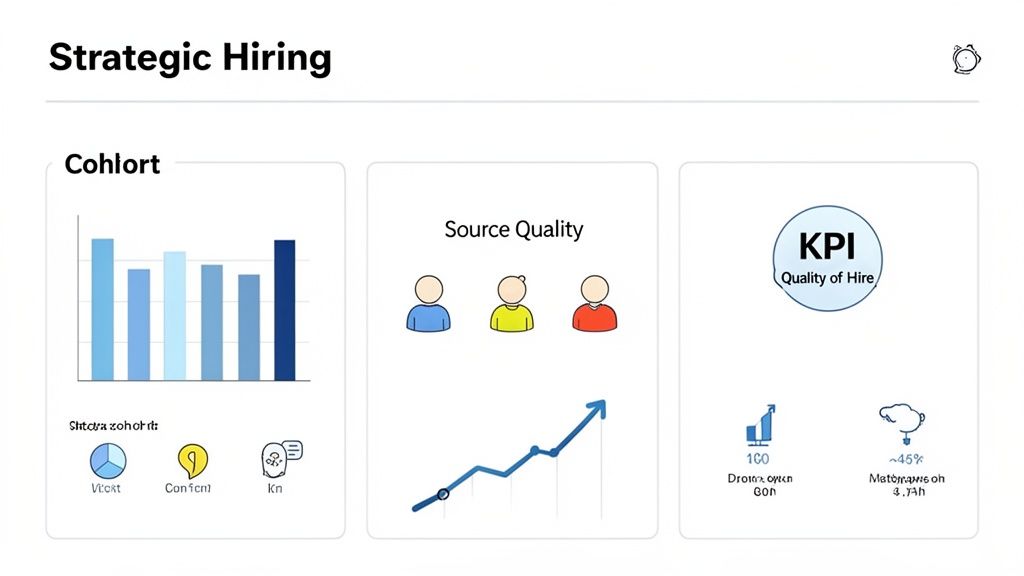
Coming up with a Quality of Hire (QoH) score for an individual is a great starting point. But the real value comes when you bring all those individual scores together. Raw numbers on a spreadsheet are just noise; a well-designed dashboard turns that noise into a story—a clear, compelling story about your recruiting team’s impact.
This isn't about generating another report that collects digital dust. It's about building a living tool that guides your strategy. Your dashboard should shift the conversation from what you did to why it mattered, proving recruiting’s value in a language the whole business understands.
See the Big Picture with Cohort Analysis
So, where do you start? One of the most insightful views you can build is a cohort analysis. Think of it like taking a class photo of your new hires. A "cohort" is simply a group of people hired around the same time, like your "Q1 2024 Hires" or the "July Sales Class."
By tracking the average QoH score for each of these groups over time, you can start connecting the dots. You can finally answer questions like, "Are the people we hired in Q2 sticking around and performing better than those from Q1?" or "Did that new interview training we rolled out in March actually make a difference?"
This method pulls the focus away from single wins or losses and puts it on the health of your entire hiring engine. It helps you see if your process changes are creating a rising tide that lifts all boats.
For instance, you might notice that your Q3 hires consistently have a higher 12-month retention rate. That single insight is a powerful clue. It pushes you to dig in and find out what you did differently in Q3. Maybe you tapped into a new sourcing channel, or a particular recruiter was on fire. Whatever it was, you can now find it and do more of it.
Sample Cohort Analysis for Quality of Hire
Here’s a simplified look at what this kind of analysis can reveal. This table tracks the average QoH score for new hires from each quarter, making it easy to spot which groups are succeeding.
| Hiring Cohort | Average Performance Score (Year 1) | 12-Month Retention Rate | Average QoH Score |
|---|---|---|---|
| Q1 2024 | 78/100 | 85% | 81 |
| Q2 2024 | 81/100 | 88% | 84 |
| Q3 2024 | 88/100 | 94% | 91 |
| Q4 2024 | 85/100 | 91% | 88 |
A quick glance tells you that something went very right in Q3. The performance, retention, and overall QoH scores are all significantly higher. A dashboard makes these patterns impossible to ignore, turning your quality of hire metrics from static numbers into a roadmap for improvement. If you want to build this muscle, diving into the fundamentals of HR data analytics is a great next step.
Answering the Questions That Matter Most
A truly strategic dashboard doesn’t just show you data; it equips you to answer the big-picture questions your leadership is asking. By visualizing your quality of hire metrics, you can finally get definitive answers.
Your dashboard should be set up to tell you:
- Which sources deliver stars? Track QoH by source to see where your best talent really comes from. Are employee referrals truly your gold mine, or is there a niche job board that’s secretly delivering incredible people?
- Who are your top talent magnets? Look at QoH by recruiter or team. This isn’t about picking favorites; it’s about identifying what your top performers do differently and then sharing that knowledge to elevate the entire team.
- Where should your money go? The data makes budget decisions objective. If LinkedIn is bringing in hires with an average QoH score of 92 while another platform is stuck at 75, you know exactly where to invest your next dollar.
Ultimately, a great dashboard closes the loop. It draws a straight line from your team’s hard work to real business growth, proving that great hiring isn't just a support function—it's a primary driver of success.
The Secret to Boosting Your Quality of Hire
Up to this point, we’ve been looking in the rearview mirror—measuring hiring success after someone is already in their seat. Metrics like performance ratings, retention, and productivity are all lagging indicators. They tell a story that’s already been written.
But what if you could shift from reacting to the past to predicting the future? The secret to improving your quality of hire metrics isn’t just about measuring results better. It's about changing the very signals you trust to make the hiring decision in the first place.
From Resumes to Reality
For decades, hiring has been ruled by the resume. We’ve been trained to scan for keywords, brand-name employers, and years of experience, hoping these are reliable predictors of success. But are they?
Experience shows a polished resume often has little connection to how someone actually performs. A resume is a highlight reel, not the behind-the-scenes documentary. This reliance on proxies for skill is exactly why so many companies struggle to land the right people, even when they invest heavily in recruiting.
Recent global HR research confirms this disconnect. It shows that while companies invest in recruiting, they often lack a structured way to measure what truly matters, leading to weak retention and slow ramp-up times. You can see how a new framework solves this in the full research and break the cycle of ineffective hiring.
The Job Flight Simulator Approach
To get better signals before you hire, you need to see your candidates in action. It’s time to stop asking them about their skills and start watching them use their skills.
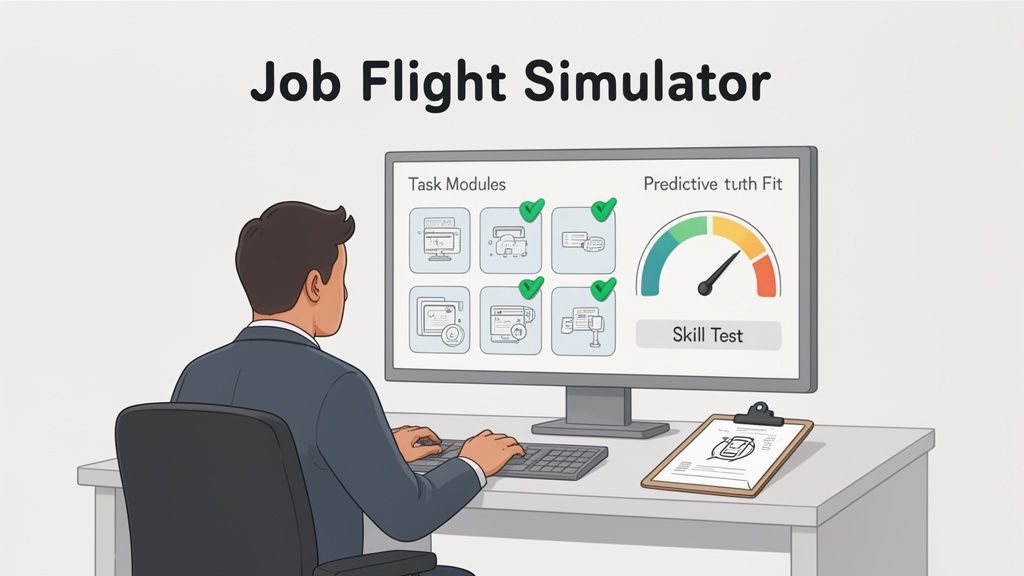
Imagine giving every serious candidate a "flight simulator for the job"—an interactive experience where they tackle the kinds of challenges they’d face on a typical Tuesday. This isn't about brain teasers or trivia. It's about seeing how they think, communicate, and solve real-world problems.
This gives you predictive data, not just a historical summary. It’s the difference between asking a pilot if they can fly and putting them in the simulator to see how they handle a storm.
See the Skills Before You Sign the Offer
This "flight simulator" idea is the core of what is often called skill verification. Instead of leaning on a resume and a few conversations, you can gather undeniable proof of a candidate’s abilities using dynamic, role-specific assessments.
Here’s what that looks like in the real world:
- A software engineer might be asked to debug a piece of code or sketch out a system design.
- A marketing candidate could be given campaign data and asked to build a new strategy.
- A sales applicant could jump into a voice role-play to navigate a common customer objection.
This is how you get past what a candidate says they can do and see what they can actually do.
When you build your process around genuine skill verification, you stop guessing and start knowing. And when you hire people who have already proven they have the core skills to excel, every single quality of hire metric you care about—from performance to productivity to retention—improves as a result. You can learn more about choosing the right candidate assessment tools to bring this strategy to life.
This proactive approach changes the entire hiring game. It ensures that the people who make it to your final round aren't just great at telling their story—they're proven performers, ready to make an impact from day one.
Getting Real About Quality of Hire: Your Questions Answered
Once you decide to start measuring quality of hire, the “how” can feel a little daunting. That’s completely normal. Moving from a great idea to a practical, working system always brings up a few tricky questions.
Let's walk through some of the most common hurdles teams face and get you the clear, straightforward answers you need to move forward with confidence.
How Can We Measure Quality for Creative or Non-Sales Roles?
This is where many teams get stuck, but the solution is simpler than you think. You can't apply a one-size-fits-all metric to every role. For positions where success isn't a number on a sales report, you have to define what "great" looks like with the hiring manager before the search even begins.
Think of it this way: what are the real-world indicators of success for that specific job?
- For a Graphic Designer: Forget revenue. Look at the usability scores of their designs. Talk to their peers about how well they collaborate. Or, rate their work against a clear competency model that balances creative flair with brand consistency.
- For a Content Writer: Their value might be found in content engagement, the SEO ranking of their articles, or how well their writing captures the company's voice, as rated by internal stakeholders.
- For an R&D Scientist: You could track the number of successful experiments they run, their contributions to new patents, or feedback from their project team on their problem-solving abilities.
The secret is tailoring your yardstick to measure what truly matters for that role.
Isn't This Metric Too Subjective to Be Reliable?
This is a common concern. And it’s true—a hiring manager’s opinion is subjective. But a smart quality of hire framework doesn't rely on just one person's feelings. The goal is to build a composite score that blends subjective feedback with hard data.
By combining a manager's qualitative rating with quantitative data like retention rates, time to full productivity, and performance against pre-set goals, you create a far more reliable and holistic view. The subjectivity of one metric is balanced by the objectivity of others.
This is exactly why objective, work-sample assessments done before you hire are so valuable. When you have concrete proof of a candidate’s skills from the get-go, you're not just relying on "gut feel" or how well they interviewed. This data-driven evidence makes the entire process more defensible and less prone to bias from start to finish.
When Is the Best Time to Measure Quality of Hire?
There isn’t one magic moment. The most insightful approach is to track progress over time, using multiple checkpoints to build a complete picture of a new hire’s journey. This gives you a trend line, not just a single snapshot, allowing you to spot issues and successes much earlier.
A great measurement cadence usually includes these milestones:
- 90-Day Check-In: Think of this as your early-warning system. It’s perfect for gauging how well your onboarding worked, how the new hire is fitting into the culture, and if they're grasping the basics of the role.
- 6-Month Review: By now, you should start seeing a clear path toward full productivity. Is the person working more autonomously? Are they taking real ownership of their projects?
- 12-Month Mark: This is often seen as the gold standard. After a full year, you have a wealth of data on their long-term performance, their actual impact on team goals, and their overall contribution. This gives you your most robust QoH score.
Tracking the story over time gives you a narrative that is far more powerful than a single data point.
We Track Nothing Right Now. What's the Easiest First Step?
If you're starting from scratch, don't try to boil the ocean. A common mistake is trying to build a perfect, complex system overnight. Instead, start small and build momentum.
Here are two simple, powerful things you can do right away:
- Create a Simple Manager Survey: Build a short survey for hiring managers to fill out 90 days after a new hire’s start date. Ask for a 1-5 rating on a few key things: performance so far, alignment with the team, and whether they'd make the same hiring decision again.
- Start Tracking Retention: This one is even easier. Just begin monitoring how many new hires in a given quarter are still with the company 12 months later. This is your first-year retention rate.
These two metrics alone—manager satisfaction and new hire retention—form the foundation of any good quality of hire program. They're easy to gather and will immediately give you a baseline to work from. From there, you can spot trends, make smarter decisions, and slowly add more sophisticated metrics as you grow.
By moving beyond resume guesswork and focusing on what candidates can actually do, you're not just filling a role—you're making a strategic investment. At Cohesyve, we help you gather that predictive evidence with dynamic skill verification, so you can hire the right person, every time. Discover how our approach can transform your hiring outcomes.